To jump to the 3D images, press or click here.
See also:
The Gateway Barrel District “Illustrative Plan” of 1,500 apartment units
3D images of Gateway Area build-out, from the Gateway Code

The draft Environmental Impact Report (EIR) for Arcata’s General Plan 2045 update was released to the public on January 29, 2024. The public has until March 18 to send comments.
This EIR contains 3D images of buildings that could be constructed in the Gateway area. Please note that these are not proposed or anticipated buildings. The images are meant to represent buildings that theoretically could be built — not anything that is on the books or is being proposed be built.
The 3D images are part of the “Aesthetics” section of the “Community Environment” chapter of the EIR. This section is meant to assess the amount of impact on “visual resources” that would be created by development — that is, the degree to which the new construction would change the scenic view.
The draft EIR document states on the last sentence of page 3.2-19:
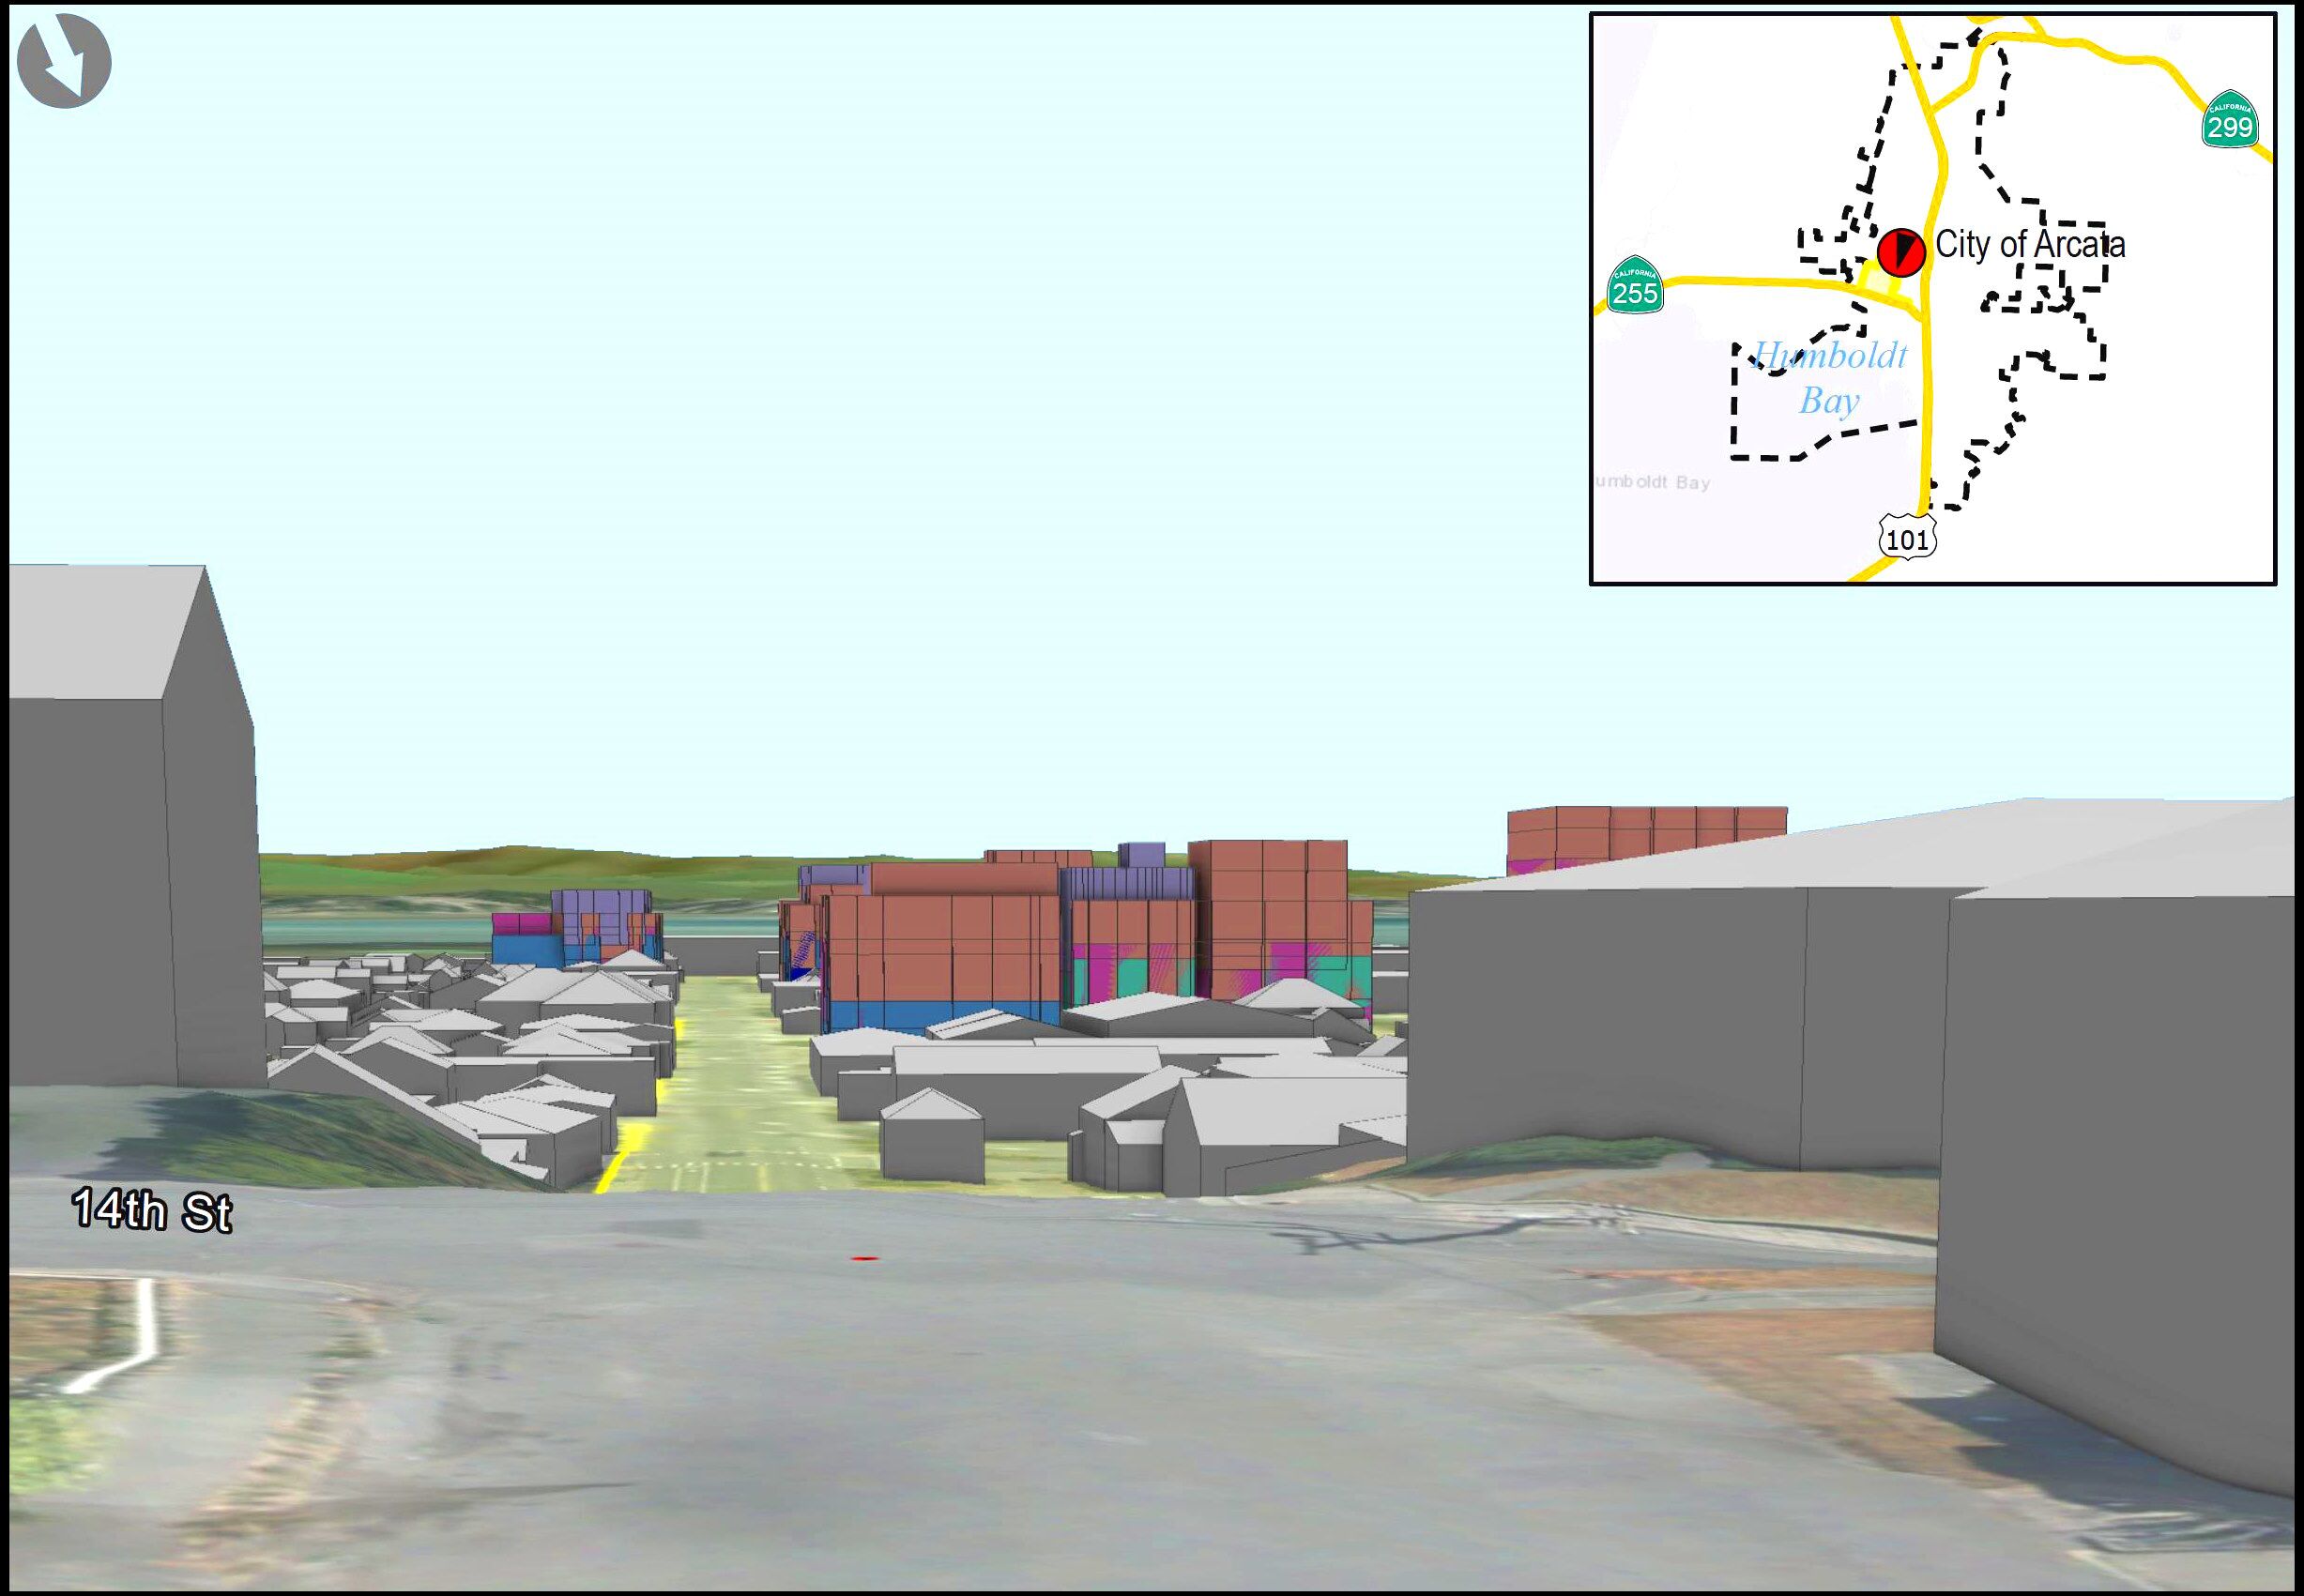
Figures 3.2-1 (A&B), and 3.2-2 (A&B) depict what a full build out scenario in the Gateway Area could look like from two locations located at the top of the hill.
This is a terrible misstatement. These images in no way “depict what a full build out scenario” would look like. Perhaps these images could represents a build-out scenario for the next 20 years — as that is the duration of what this draft EIR is looking at. But that’s not what the document says. Very sloppy wording.
For a more clear idea of what a full build-out might look like, see 3D images of Gateway Area build-out, from the Gateway Code.
Contents
Click on a menu item to go directly to that section.
- Some problems with these images.
- The images.
- Images from Google Earth, from a similar viewpoint and perspective.
- Gateway-Barrel District Illustrative Plan.
- What the draft EIR says about the impact on views.
- Pages from the draft EIR: “Impacts and Mitigation Methods” and the full-page figures.
Pages from the document.
Some problems with these images
In these images, we can note:
- The green or green-brown strip toward the top of some images is Arcata Bay.
- The white strips on the hills on the Eureka side of the bay are who knows what.
- The four buildings shown are based on the buildings devised for the Urban Field Studio report on test sites in the Gateway area. All these buildings were declared, in that report, to be infeasible to actually construct. See the articles on Arcata1.com here and here.
-
- Samples of statements from the report: “Current economics likely won’t work for structured parking.” “Adding structured parking and an elevator may make financial feasibility impossible.” “Large setbacks reduce the buildable area and ability to have onsite parking. This can create challenges to obtaining funding for the project and financial feasibility.”
-
- There is no date on this illustrative plan. I get the impression that it was made perhaps two years ago (or more) — prior to the Planning Commission discussing and adopting many policies that would have this illustrated plan be, well, of no value.
-
As shown, it portrays the Barrel District as having 1,500 dwelling units. At the called-for 1.25 parking spaces per dwelling unit, that amounts to 1,875 residential parking spaces. (The Gateway Code, from the beginning, called for 0.5 spaces per dwelling unit in the Barrel District — that is, one space for every two apartments — and 0.25 in the Hub and Corridor Districts, e.g. 1 space for 4 units.)
The 150,000 square feet of commercial space calls for 5 parking spaces per 1,000 square feet, for an additional 750 spaces. Total parking spaces required, per this illustration, is 2,625 parking spaces. This amounts to approximately 18 or 20 acres of parking. To put this in perspective, the entire Barrel District is shown as about 35 acres. The number of parking spaces at the Bayshore Mall is in the vicinity of 1,200. Uniontown Shopping Center, with Safeway and CVS, has about 250 parking spaces.
And yet this “illustrative plan” shows what looks to be zero parking spaces. It’s hard to say, as the drawing isn’t clear. Possibly the parking could be in the lower levels of the buildings — but it would require about two floors of parking in each building to get close to that 2,625 number.
In other words, this “illustrative plan” is bogus is 100% bogus.
We can acknowledge that this plan is, as it states in small print, “for illustrative purposes only.” Regardless, this plan breaks perhaps dozens of policies and guidelines that have been developed during this over-two-year Gateway Area Plan discussion.
The four buildings shown are located, from left to right:
-
- The St. Vinnie’s site, on the east side of 5th and K Streets.
- The AmeriGas site, full block, between 6th and 7th Streets, between K and L Streets.
- The car wash site, with Jolly Giant Creek (shown as covered up), full block, between 9th and 10th Streets, between K and L Streets.
- The Tomas / Open Door Clinic building (green metal roof in the Google Earth view), Montessori Garden, and empty lot, 1-1/2 blocks total size, from 8th Street south to half-way to 6th Street, to the west of L Street over to what would be N Street.
- The first image below shows development on 4 parcels in the Gateway area. Some of the images, because of the angle of perspective, just show 2 buildings. This is disingenuous. In those instances, the view should have been made wider, in order to see the 4 parcels with new development.
- In the K Street images, “L St” is indeed L Street. The linear park that the Gateway Area Plan has intended for the L Street Corridor is not depicted in these images.
- You will want to disregard the meaning of the colors. The colors on the buildings are different in different images. As shown, some images show three floors of low-density “penthouse” (luxury) apartments in the Tomas site building and St. Vinnie’s building, and restaurants on the first, second, and third floors of the car-wash site building.
The images
The images here were cropped from the full pages, taken from the draft EIR. (The full pages are below.) They were modified as follows: Cropped for size; brightness and contrast adjusted for clarity on the screen; colors made a little more saturated in order to help see the color-coding in the floors of the buildings.
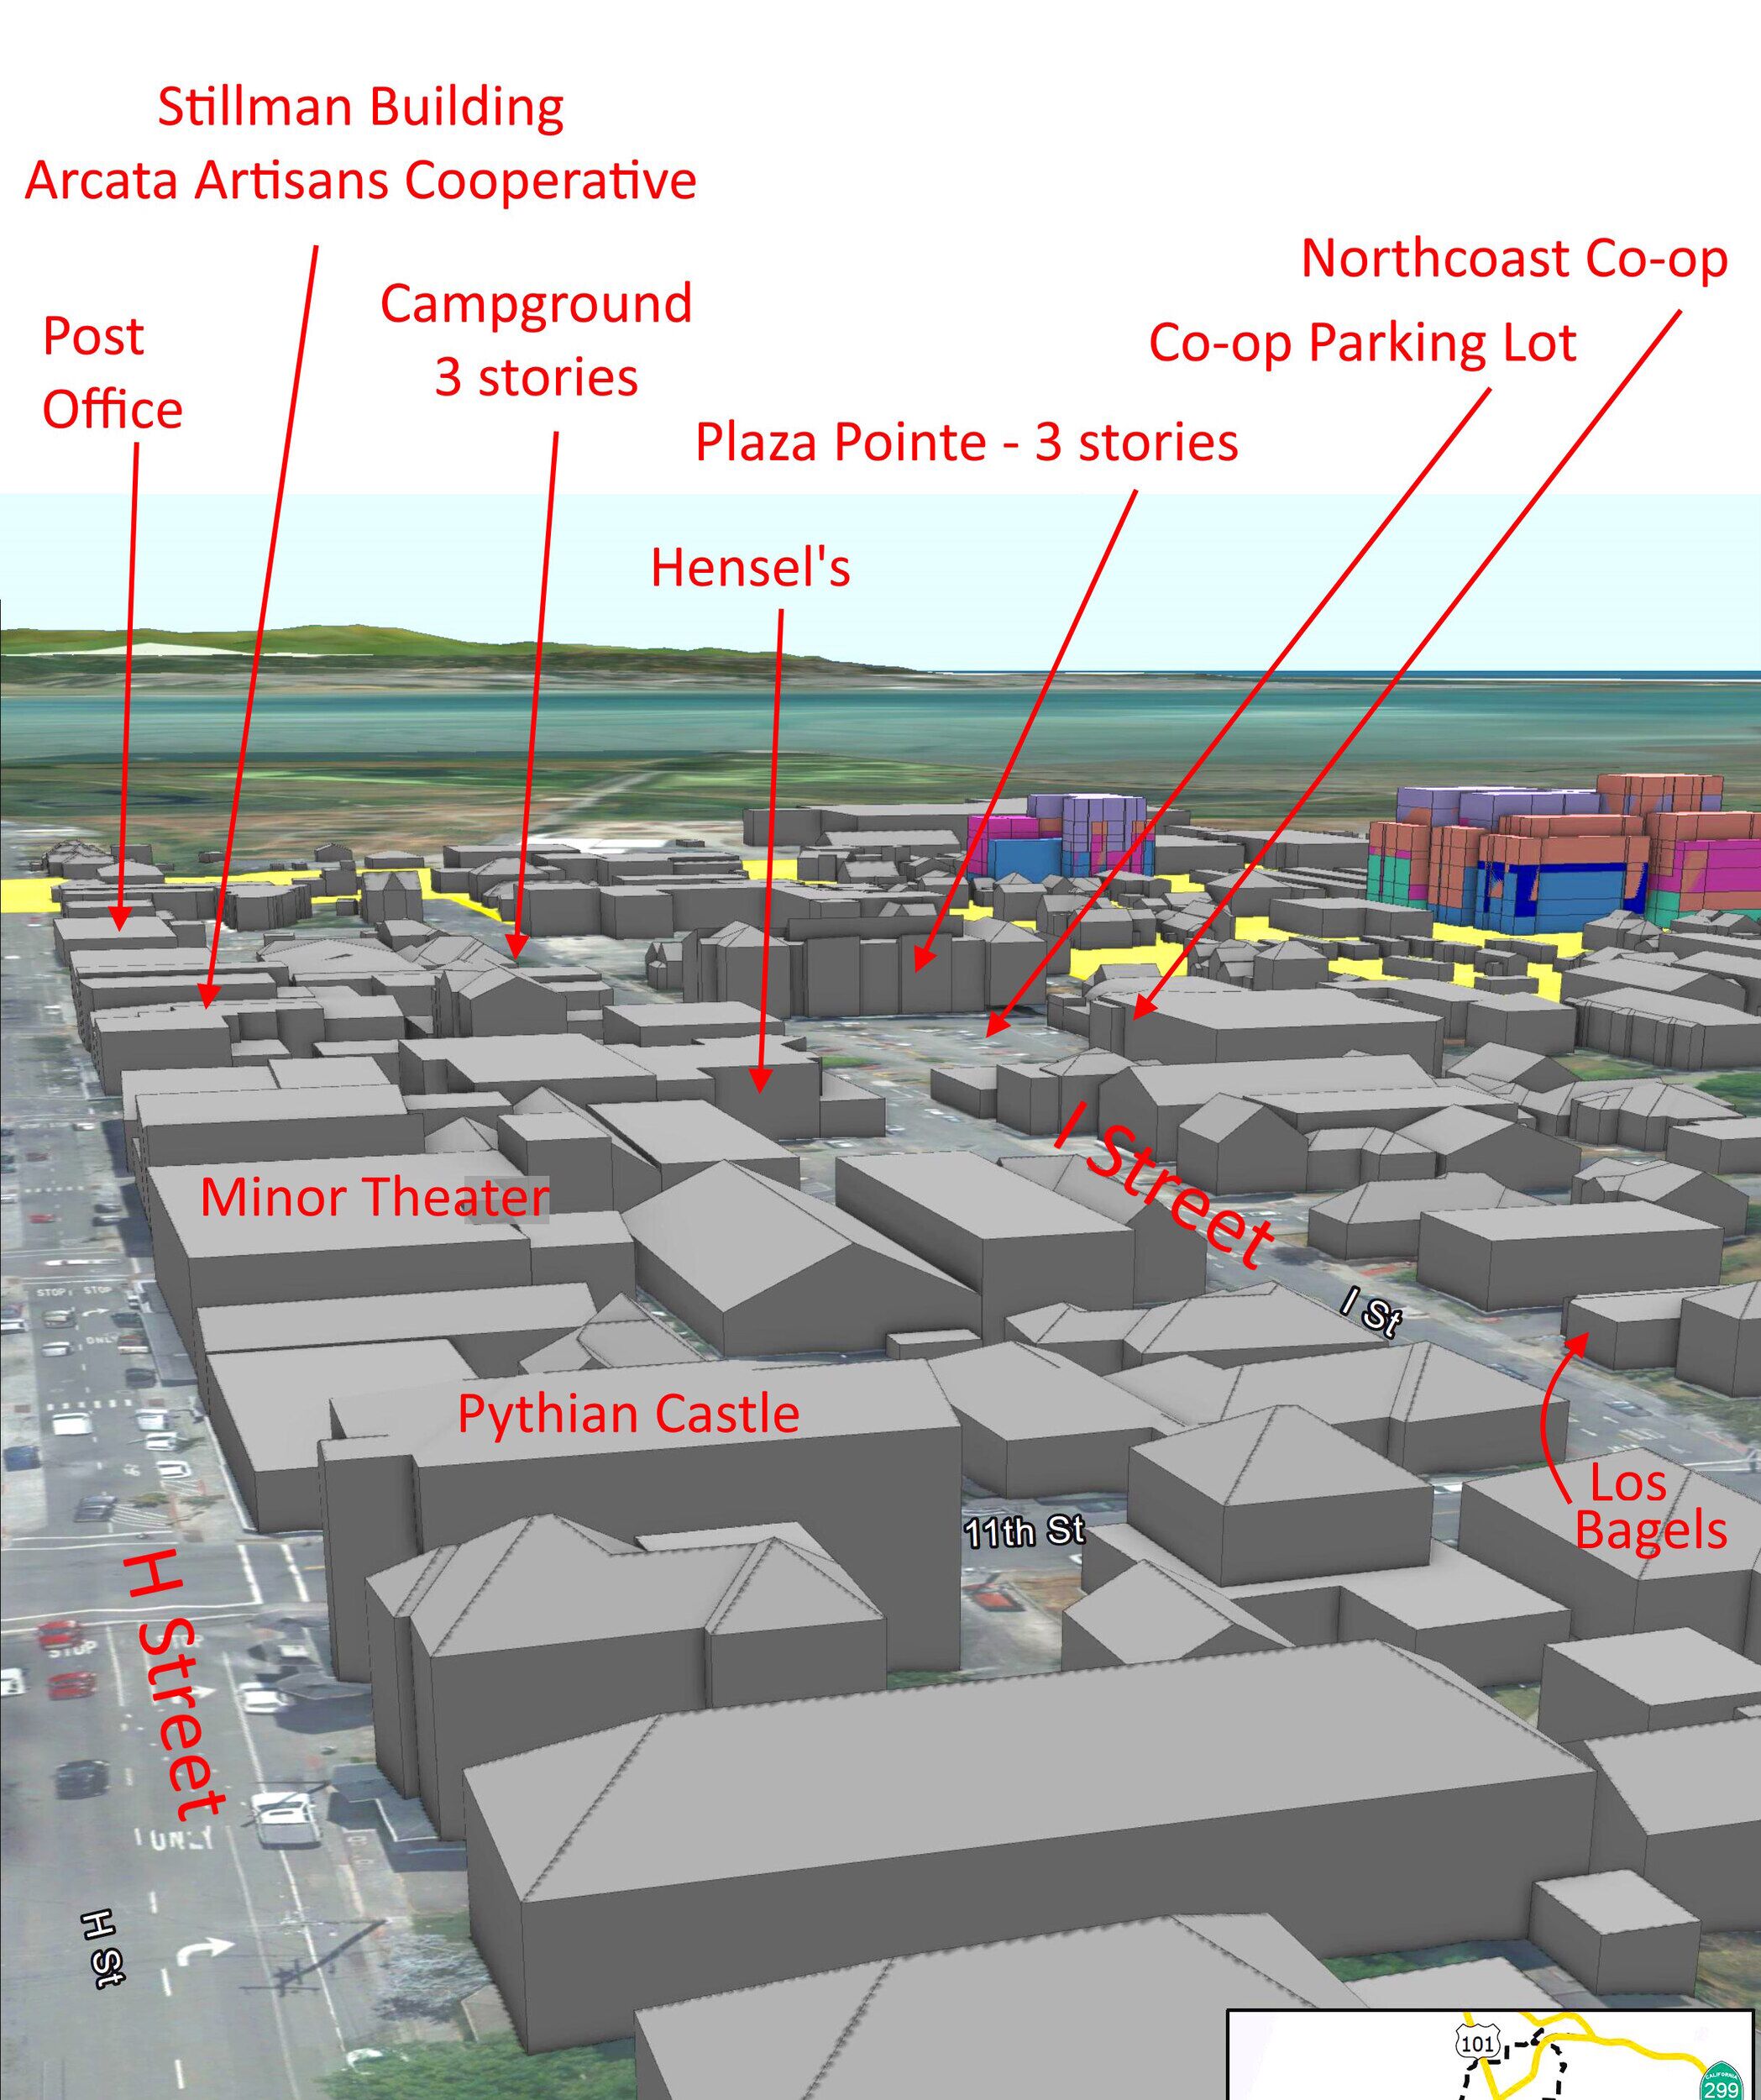
There are two “orientation” images, with labels of existing buildings and arrows to help you establish what you’re looking at. Otherwise these images appear as just a bunch of rooftops.
To get orientated:
Color code:


Figure 3.2-2B. View of Gateway Area. Looking south from K Street. 100 feet above the ground. Following Page 3.2-26. PDF page 99.

Figure 3.2-3B. View of Gateway Area. Looking northwest from Samoa Boulevard. 10 feet above the ground. Following Page 3.2-26. PDF page 101.
 Figure 3.2-3A. View of Gateway Area. Looking northwest from Samoa Boulevard. 10 feet above the ground. Following Page 3.2-26. PDF page 100.
Note that this image shows just two of the four potential buildings.

Figure 3.2-2A. View of Gateway Area. Looking south from K Street. 10 feet above the ground. Following Page 3.2-26. PDF page 98.
The draft EIR has two 3D figures which are called “View of Arcata Plaza.” But the Arcata Plaza cannot be seen in these figures.
For orientation, here is the Figure 3.2-1B with some of the buildings labeled.

Figure 3.2-1B. “View of Arcata Plaza.” Looking south from H Street. 100 feet above the ground. Following Page 3.2-26. PDF page 97.
Note that this image shows just two of the four potential buildings.
Note: This figure is called “View of Arcata Plaza” but the Arcata Plaza is not in this view.

Figure 3.2-1A. “View of Arcata Plaza.” Looking south from H Street. 10 feet above the ground. Following Page 3.2-26. PDF page 96.
Note that this image shows just two of the four potential buildings.
Note: This figure is called “View of Arcata Plaza” but the Arcata Plaza is not in this view.
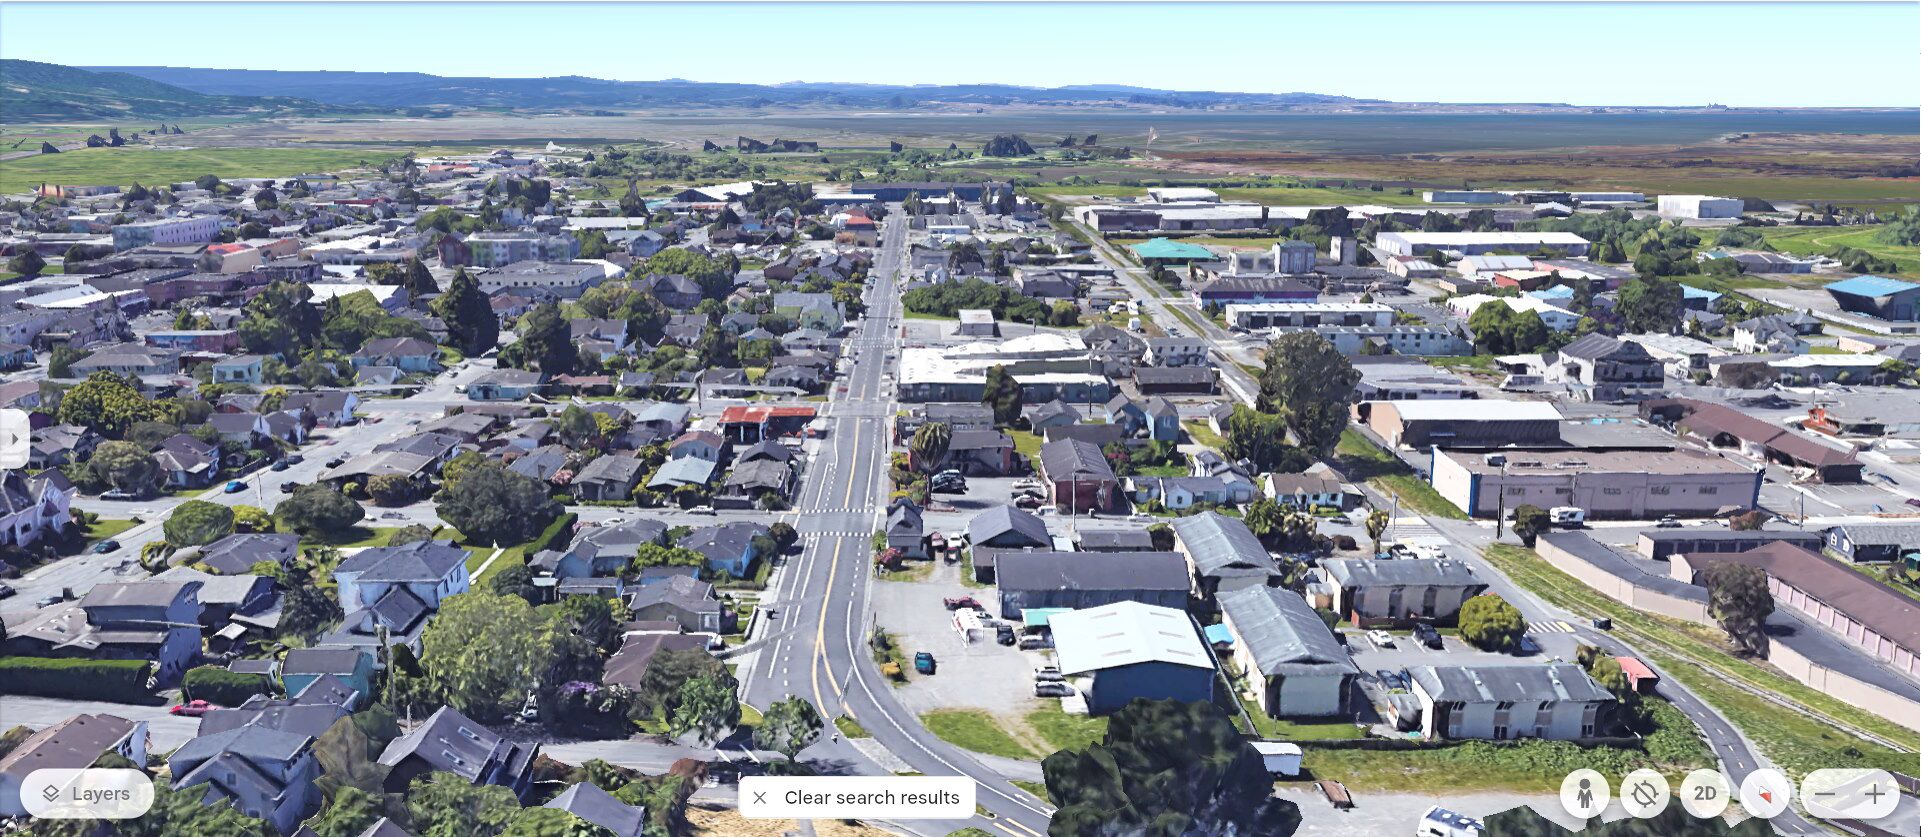
Images from Google Earth, from a similar viewpoint and perspective

Full-width view:

Gateway-Barrel District Illustrative Plan
From page 2.0-14 of the draft Environmental Impact Report. (PDF page 44)

This image of “Gateway-Barrel District Illustrative Plan” has no date. There is no explanation of what it is in the text of the draft EIR document other than “See Image 2-2 for the Gateway-Barrel District illustrative plan.”
The plan, as shown, is difficult to properly see. Everything that is tan or dark brown or reddish-brown is the roof of a building.
As shown, it portrays the Barrel District as having 1,500 dwelling units. At the called-for 1.25 parking spaces per dwelling unit, that is 1,875 parking spaces. The 150,000 square feet of commercial space calls for 5 parking spaces per 1,000 square feet, for an additional 750 spaces. Total parking spaces required, per this illustration, is 2,625 parking spaces. This amounts to approximately 18 or 20 acres of parking. To put this in perspective, the entire Barrel District is shown as about 35 acres. The number of parking spaces at the Bayshore Mall is in the vicinity of 1,200. Uniontown Shopping Center, with Safeway and CVS, has about 250 parking spaces.
And yet this “illustrative plan” shows either about 30 parking spaces… or zero. It’s hard to say, as the drawing isn’t clear. Possibly the parking could be in the lower levels of the buildings — but it would require about two floors of parking in each building to amount to that 2,625 number.
In other words, this “illustrative plan” is bogus is 100% bogus.
The Gateway Code has a parking figure for apartments in the Barrel District as being 0.5 per dwelling unit — that is, one parking space for every two units. In the Corridor and Hub Districts, it is 0.25 — one parking space for every four apartments.
We can acknowledge that this plan is, as it states in small print, “for illustrative purposes only.” Regardless, this plan breaks perhaps dozens of policies and guidelines that have been developed during this over-two-year Gateway Area Plan discussion.
For a further discussion on this absolutely horrible and misleading “illustrative plan” see the article here on Arcata1.com.
What the draft EIR says about the impact on views
The development that would occur through the implementation of the new General Plan is by design — that is: It is not accidental; it is on purpose. Through the logic used in this Environmental Impact Report, since it is by design it is therefore of no cumulative impact.
From the draft EIR. Page 3.2-26, PDF page 95.
“The proposed General Plan 2045 encourages smart growth development that is anticipated to make the City feel and appear more urban. This is not incidental, rather it is by design and, therefore, is not considered a cumulative impact because the intent of the General Plan 2045 is to implement smart growth design principles which include building upwards as opposed to outwards.”
In other words, the taller buildings are part of the design. Since taller buildings are part of the General Plan, then the impact is known. Since the impact is known, then it’s not an impact.
Does anyone else consider this to be circular logic?
That is to say: Illogical. Without logic.
In Arcata we are in agreement that we want to build up — to redevelop existing underdeveloped properties — rather than out, meaning out into the agricultural bottom land or into the forests. But the statement above is disingenuous.
Making four-story buildings will also “make the City feel and appear more urban.” It’s a matter of degree. Smart-growth design principles in themselves don’t necessitate going up to seven stories.
The draft EIR: “Impacts and Mitigation Methods” and the full-page figures.
Pages 3.2-19 through 3.2.26 plus figures. Pages 88-101 in the PDF.
You can use the + and – keys to expand or reduce the PDF. The pages can be saved or printed using the icons at the upper right.
Cell Phones: The PDF views may appear too large on the cell phone screen. Either reduce the image size using the – key to about 40%, or scroll down for the cell phone viewer.
Cell Viewer
Pages from the document
Full pages of the images. These can also be seen with the PDF viewer, above.
In the document, following page 3.2.26. PDF file pages 96-101.
Text from the draft EIR. Page 3.2-19 and 3.2-20. Highlighting in bold is added.
Views of the Gateway and Downtown Infill Opportunity Zones are most visible from high elevation areas in the City such as along 14th Street, along Samoa Blvd facing northwest towards Manila, and immediately adjacent to the Gateway Area. Scenic vistas most likely to be affected by implementation of the General Plan 2045 due to development within the Gateway Area include views looking south and east towards Humboldt Bay and the mountains from 14th Street at the intersections with G, H, I, J, and K Streets (i.e., “the top of the hill”). Images 3.2-1 through 3.2-3 depict existing conditions using Google Earth imagery. Figures 3.2-1 (A&B), and 3.2-2 (A&B) depict what a full build out scenario in the Gateway Area could look like from two locations located at the top of the hill.
Figures 3.2-1 through 3.2-3 illustrate 500 new dwelling units with businesses and offices on the first floor of each building. These figures depict how this particular scenario of development would look at the street level and from an aerial perspective; however, it should be noted that these figures are purely illustrative for the purposes of this analysis and development will likely occur in other scenarios within the confines of allowable development per district. Figures 3.2-1 through 3.2-3 include views of the Gateway Area from the following locations and elevations. Existing views at each location are provided below as Images 3.2-1 through 3.2-3.
– Figure 3.2-1A: 13th & H Streets at approximately 10 feet above ground level.
– Figure 3.2-1B: 13th & H Streets at approximately 100 feet above ground level.
– Figure 3.2-2A: 14th & K Streets at approximately 10 feet above ground level.
– Figure 3.2-2B: 14th & K Streets at approximately 100 feet above ground level.
– Figure 3.2-3A: Samoa Blvd & SR 101 ramp at approximately 10 feet above ground level.
– Figure 3.2-3B: Samoa Blvd & SR 101 ramp at approximately 100 feet above ground level.


