

“Solar Shading Impacts 3D GIS Analysis” video
from Arcata Community Development Director David Loya
September 8, 2023 4 minutes 46 seconds
1. Comments on this video
2. Transcription of the video, with every image
3. The video. 4 minutes 46 seconds
Prior to this video, there was a distinct lack of any graphic images showing the impacts of shadowing from the taller buildings permitted in the Gateway area. Unfortunately, this video does not help much. Community Development Director David Loya has in the past made some good videos on Gateway issues, but this is not one of them.
Because the video shows some of the important images for just seconds at a time, I felt it would be worthwhile to extract every image from the video and have them in an article. This way, you can have some time to actually look at and compare the shadowing of the buildings on other buildings.
A different way of looking at solar shading is here on Arcata1.com. Three brief videos (35 seconds) show the effect of shadows from taller buildings during the entire day.
The City of Arcata has spent over $35,000 on 3D imagery, and we’ve seen very, very little as a result. The shadow images shown in this video are based on 3D images of hypothetical buildings that were done prior to August, 2022 — more than a year ago, and well before the first draft of the Form-Based Code (the Gateway Code) came out in June, 2023. The 3D images shown in this video were also used in the “Building and Massing” video series, from August, 2022.
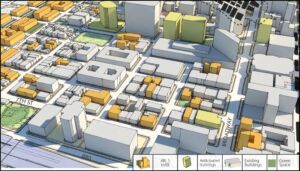 The December, 2021, contract amendment for $118,000 included a provision for “Plan Area Massing Diagram” — it’s been over 8 months now, and we’ve seen nothing. What was promised at that time was depicted in an example image, shown at the right. It would indeed show shadows from new buildings, on a larger scale than just the three buildings depicted in this video. For more on what was promised from the City’s consultant on this important bit of Gateway information, see Planwest 3D Massing Diagrams are non-existent — No 3D diagrams to evaluate the Gateway heights and massing here on Arcata1.com.
Welcome to another video on the Gateway Area Plan. Today we’re going to be looking at solar shading, using our 3D GIS, and I’ll tell you a little bit about the analysis that was done there and share with you some images to let you draw your own conclusions.
My name is David Loya. I’m the director of Community Development with the City of Arcata. And I’d love to hear from you if you have reactions or responses you’d like to make related to this video. Please go ahead and email me or give me a call. As always, our City Council would love to hear from you as well.
I’m using the same model that was developed for the last videos that we produced, both the Building and Massing video put out in August 2022, as well as the GIS and Graphics support video that was put out this month, 2023, August. So you should see those videos for additional information about how the models were built. But I’ll be using those images; they should be familiar to you.
I will explain a little bit about these images for new users so you don’t have to go back and watch those.
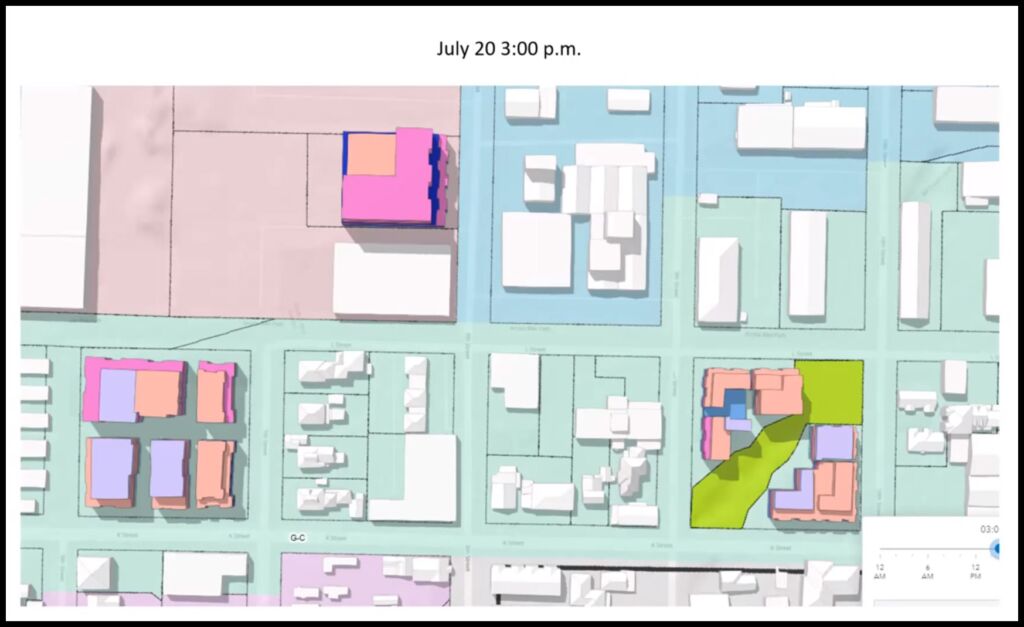
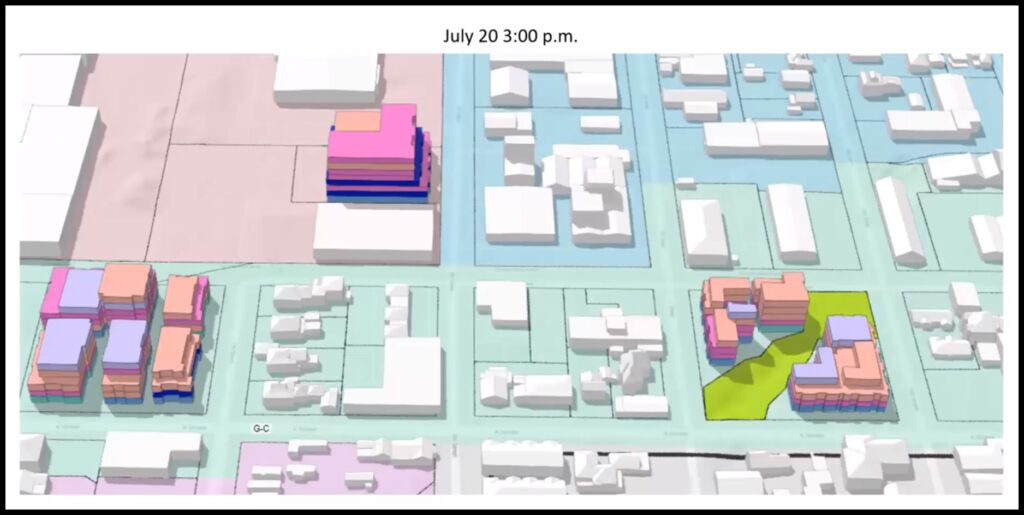
What you’re seeing here is an image of a center of the Gateway area. You see the Creamery building in the very center. Here is the actual building itself, as modeled in 3D GIS, as are all the other white buildings — actual buildings that are on the ground today — that were built out of the GIS model using various data sources. The more colorful multi-colored buildings that you see on the Car Wash parcel down here in the bottom right-hand corner, the AmeriGas parcel (bottom left-hand corner), and the parcel across the street from the Creamery building were built in the GIS world. They’re not real buildings. They’re not proposed buildings — they’re buildings that conform to the constraints and the development parameters that could be implemented through the Code [the Form-Based Code, “Gateway Code”], but these are not actual buildings.
Even though they’re not actual buildings, the 3D GIS can make them cast shadows. It treats them as though they’re actual buildings. And so the GIS is looking at all of these buildings — the modeled buildings and the existing buildings — and it’s using our latitude to cast shadows based on a particular date in the year at a particular time during the day and so what you’re looking at here today, or here right now, is July 20th at 3 p.m. in the afternoon and you can see in the middle of the Summer even these very large buildings do not cast shadows off the properties at three o’clock in the afternoon.
Now I should also state before we get into the other images that these buildings were based on the original proposal. The Planning Commission has made a recommendation to reduce the building height by one story. And so you can see in these images a larger impact than what would be currently cast by buildings that could be built based on the proposed draft code currently.

Okay, so we’re going to scan through the year we’re going to jump ahead a couple of months, [from] July to September. You can see the shadows are casting longer. The sun is lower in the sky.
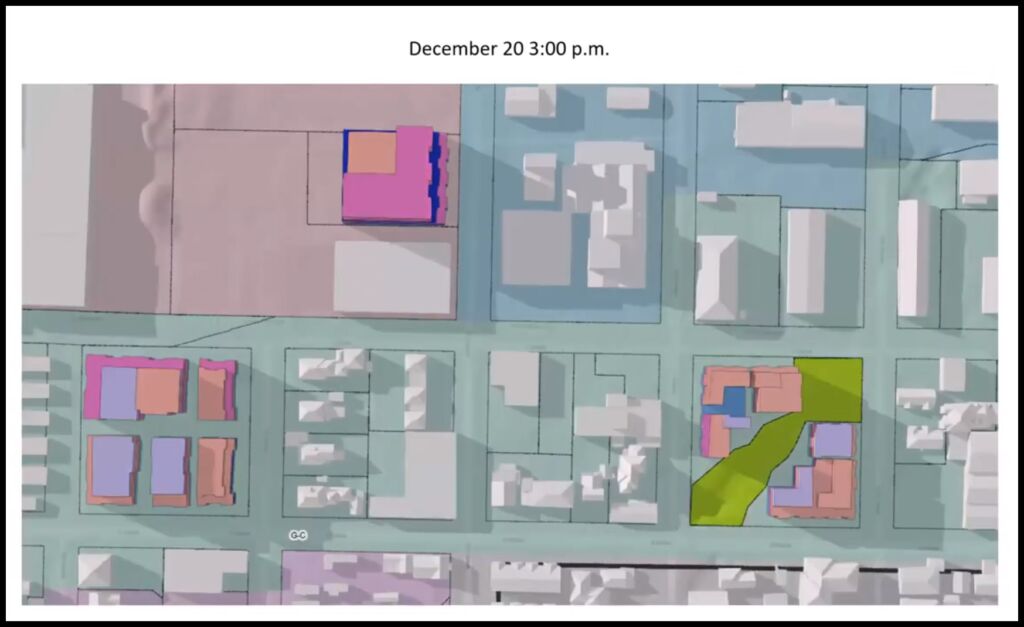
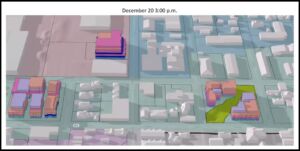
By December the shadows are cast quite far. If the sun is shining at 3 p.m. in the middle of the December, you will see them cast pretty far.

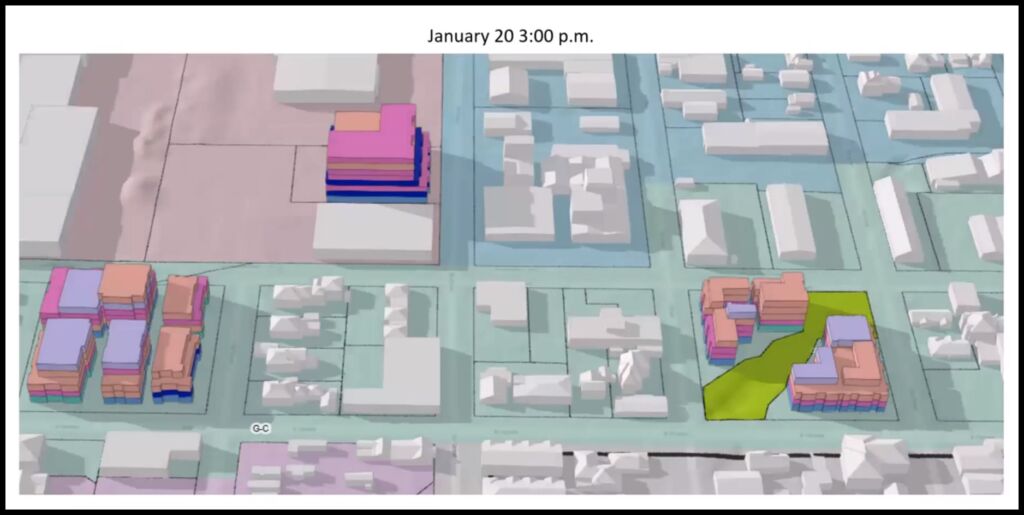
Now to move forward through the year, we’re going to go into January and we’re going to start month by month, looking at the retraction of those shadows as the sun starts to get higher in the sky.

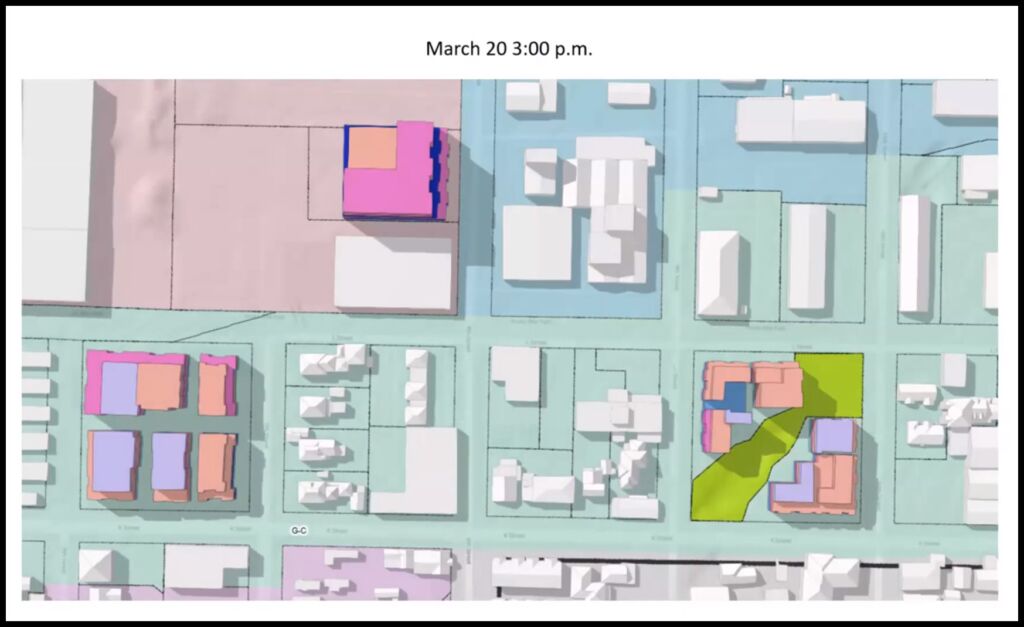
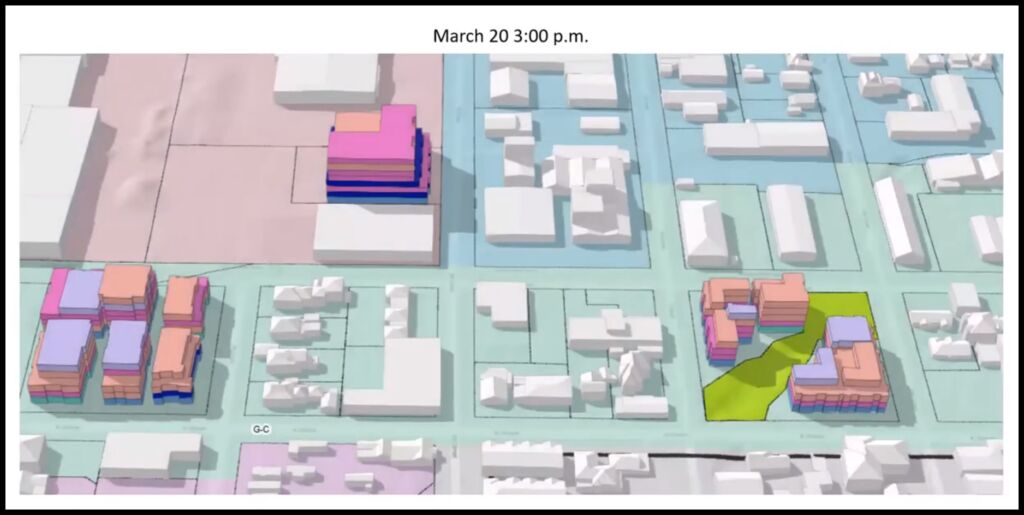
Out to March. So I’m going to toggle back and forth through these images so you can see them in terms of how they would cast throughout the year.
Now we’re going to look at this isometric view, a little three-dimensional view. The same images, the same times of day, same dates throughout the year. Here’s July, September, December, January, February, and March.


Again this gives you a sense of how these buildings, if they were built, would impact the properties nearby in terms of the shadows that they would cast.
And I hope this has been helpful for you. It’s a quick video just to get a sense for how these buildings might affect the adjacent properties. And hopefully you can draw some conclusions from that and be a little bit more informed in your conversations around solar shading.
“Solar Shading Impacts 3D GIS Analysis” video
from Arcata Community Development Director David Loya
September 8, 2023 4 minutes 46 seconds